It's being called "the best DNA webinar yet", and "maybe the best webinar ever." One viewer said, "I have taken week-long DNA courses and listened to countless DNA lectures. No lecturer has ever demystified X-DNA." The webinar, and the topic that everyone is talking about, is this week's live webinar by Debra Renard:
Which Spot Does X Mark, Anyway? X-DNA Testing in Action
Because X-DNA isn't a stand-alone test, it's an overlooked research tool and even confused with mtDNA and autosomal DNA. As Debra illustrated, looking at the X really can solve unknown parentage mysteries. Watch the webinar here.
What turned on the DNA light bulb for me were the inheritance charts she showed. It helped so much to see how the XDNA is passed to descendants, thus helping the researcher narrow down potential relationships of DNA matches.
Even more helpful is the fact that the Legacy Family Tree software has the XDNA relationships built in to its charts. Here's how to see your XDNA chart.
1. In Legacy, click on the Legacy Charting button in MyToolbar.
2. Choose one of the ancestor charts like the Upward or the Half Fan.
3. On the Appearance tab, click on the Color button. Change the theme to DNA X Chromosome.
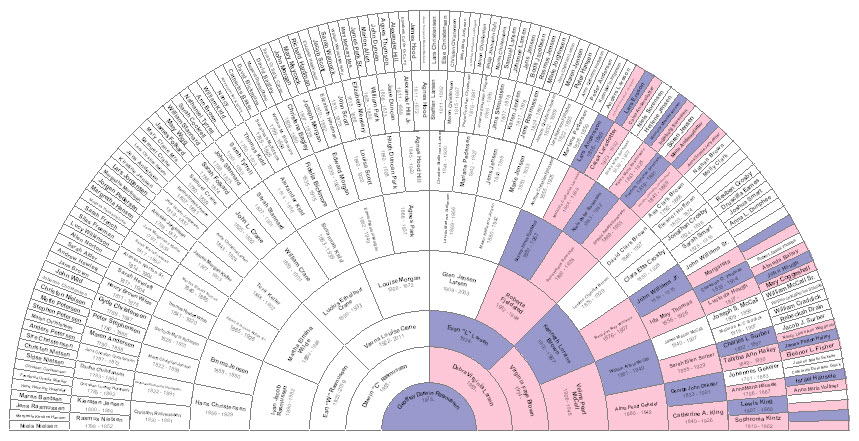
Here's what my Half Fan chart looks like with this theme selected:
The chart makes it simple to visualize which relationships in my tree could account for an XDNA match.
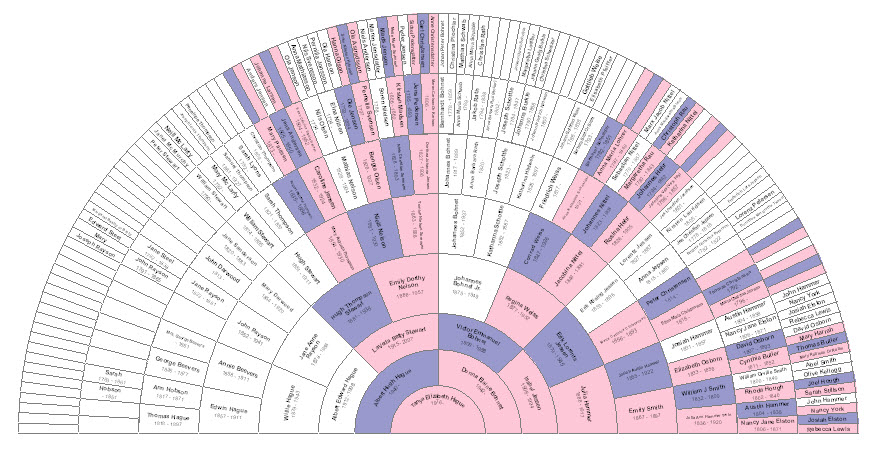
Here's my wife's Half Fan chart:
If I found an XDNA match, the chart helps me know that the match could not be on my paternal side of the tree, and shows which part of the tree it could have come from. If my wife found an XDNA match, the possibilities are pretty different.
So…if XDNA is new(er) to you, check out both the webinar and your Legacy software.


Thanks for this tip. This chart makes it a bit easier to relate information to family members who are not into the details of DNA and genealogy but are impressed with the confirmations of the relationships. Showing eight generations is really cool with this format!